PISA 2025: The Key Findings and What They Mean

The latest PISA results offer a window into what young people can do with their learning: understand an explanation, evaluate evidence, and reason through an unfamiliar problem. They reveal areas of progress, persistent challenges, and some surprising differences between how students perform and how they experience school.

PISA, the Programme for International Student Assessment, examines how 15-year-olds apply their knowledge in reading, mathematics, and science. Its 2025 assessment involved more than 760,000 students across 91 countries and economies, with science as the main subject. Results were released on September 8, 2026. OECD overview
The clearest overall finding is that reading and mathematics continued to decline. Across 35 OECD countries with comparable results, reading fell about 14 points and mathematics 9 points between 2022 and 2025. Science was broadly unchanged: its small decline was not statistically significant. OECD trend findings
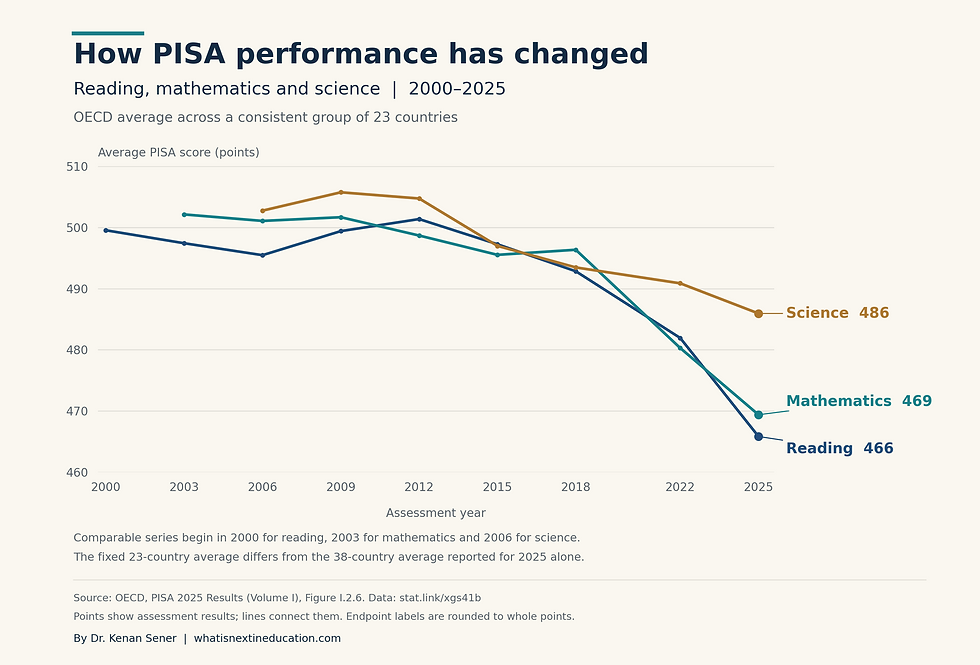
The chart follows the same 23 OECD countries over time. The 2022–2025 changes discussed above use 35 comparable countries, while the 2025 OECD averages in the table below cover 38 countries. Source: OECD, Figure I.2.6
For the United States, students remained above the OECD average in reading and science and close to it in mathematics. Compared with 2022, U.S. reading performance declined, while mathematics and science showed no significant change. OECD U.S. findings
Subject | U.S. average, 2025 | OECD average, 2025 |
Reading | 490 | 461 |
Mathematics | 463 | 463 |
Science | 502 | 482 |
Scores are PISA points, not percentages. The OECD average summarizes member-country results. OECD score table
The U.S. sample did not meet all OECD participation and inclusion standards, creating uncertainty about how representative its results are. Even with that qualification, the distinction is useful: being above an international average and improving over time are different achievements. OECD U.S. sampling guidance
International results also show why both achievement and improvement deserve attention. Singapore led in reading. The participating Chinese jurisdictions of Beijing, Shanghai, Jiangsu, and Zhejiang led in mathematics and science; those results do not represent all of China. Türkiye improved in all three subjects compared with 2022. OECD international results
These examples offer starting points for closer study of teaching and curriculum. Scores alone cannot identify which policies produced the results.
Reading deserves particular attention. On average across OECD countries, about 31% of students scored below PISA’s baseline reading level. The corresponding shares were 35% in mathematics and 26% in science. Below-baseline reading does not mean a student cannot read; it indicates difficulty with tasks such as identifying the main idea in a moderately long text. OECD proficiency findings
A student might recognize every word yet miss a condition in a mathematics problem or a qualification in a scientific claim. Reading with understanding helps students reason across subjects and make informed decisions beyond school.
The timeline matters, too. The chart shows that reading and science performance had begun weakening before the pandemic, while mathematics declined particularly sharply after 2018. Neither COVID-19 nor generative AI can therefore explain the entire trend. Understanding today’s results requires considering both longstanding challenges and more recent disruptions.
AI is nevertheless becoming part of the learning picture. Across OECD countries, 46% of students reported using AI chatbots at least weekly to help them learn. Students using AI for specific tasks such as drafting and summarizing scored lower in science than non-users, while weekly general users performed similarly to non-users. These associations do not establish cause and effect. OECD AI findings
Students who struggle may seek more help, and differences in teaching or background may also matter. My interpretation is that frequency of use tells us too little. The more revealing question is what students understand after receiving assistance and whether they can apply it again.
A new part of PISA examines learning during the test itself. In the computational problem-solving assessment, students can use feedback and resources while working with digital tools. Their performance reflects how they adapt as well as what they already know. OECD assessment analysis
About two-thirds of students across OECD countries reached Level 3 or above, indicating solid skills. This new assessment establishes a starting point for future comparisons. OECD digital problem-solving findings
The findings on fairness are more complicated. Between 2022 and 2025, achievement gaps between more and less advantaged students narrowed across OECD countries largely because the more advantaged students’ scores declined. A smaller gap is most encouraging when students who need greater support are learning more. OECD equity findings
There is encouraging news about school life: in 39 education systems, a larger share of students felt they belonged at school than in 2022. Across OECD countries, 76% reported that sense of belonging. OECD school belonging findings
These findings show how different parts of education can move in different directions: stronger belonging alongside weaker academic results, and promising digital skills alongside difficulties with reading. Each tells us something worth understanding.
PISA measures only part of education, but its findings help us understand where students are succeeding and where they need more support. Meaningful progress is reflected in what young people can do: explain an idea, reason through an unfamiliar problem, and evaluate the evidence behind a claim. These are abilities that give learning value well beyond the classroom.


Comments